Report to/Rapport au :
Corporate Services and Economic Development Committee
Comité des services organisationnels et du
développement économique
and
and Council / et au Conseil
29 November 2004 / le 29 novembre 2004
R.T. Leclair, Deputy City
Manager/Directrice Municipale Adjointe
Public Works and Services/Services et
Travaux Publics
Contact Person/Personne
ressource : R.G. Hewitt, P.Eng., Director/ Directeur
Infrastructure Services/Services d'infrastructure
(613) 580-2424 x21268, Richard.Hewitt@ottawa.ca
SUBJECT: LONG RANGE FINANCIAL PLAN 2 – RATE SUPPORTED PROGRAMS
OBJET : PLAN
FINANCIER À LONG TERME 2 – PROGRAMMES FINANCÉS PAR LA TARIFICATION DE
SERVICES
REPORT RECOMMENDATIONS
That the Corporate
Services and Economic Development Committee recommend that Council approve of
the following principles to improve the financial sustainability of the water
and sewer rate supported programs:
a) That the annual Pay-as-you-go contributions be indexed in
accordance with the Infrastructure Price Index as published by StatsCan,
consistent with the approved policy contained in the tax supported Long Range
Financial Plan;
b) That long term debt financing be limited to specific project types
– growth, development charge financed, regulatory and major projects with long
term benefits, consistent with the approved policy contained in the tax
supported Long Range Financial Plan;
c) That the balances in the Water and Sewer Reserve Funds be combined
into one reserve fund;
d) That the combined Water & Sewer Reserve Fund retain a minimum
balance of $20 million;
e) That the 2005 net water and sewer rate be increased by 9%,
comprised of a 12% water rate increase and a 4% reduction in the sewer
surcharge;
f) That for longer term sustainability of rate supported programs,
City Council endorse net annual water and sewer rate increases of 9% for 2006
and 2007, and 5% for 2008 to 2014, subject to annual budget approval.
RECOMMANDATION DU
RAPPORT
Que le Comité des services organisationnels et
du développement économique recommande au Conseil municipal d’approuver les
principes suivants afin d’accroître la viabilité financière des programmes
financés par la tarification des services d’eau et d’égout :
a) Que
les contributions par répartition annuelles soient indexées en fonction de
l’indice des prix d’infrastructure publié par Statistique Canada, conformément
à la politique approuvée dans le Plan financier à long terme financé par
l’impôt foncier;
b) Que le financement par emprunt à
long terme soit réservé à des types de projet précis, soit ceux destinés à
faire face à la croissance, ceux qui sont financés à même les redevances
d’exploitation, ceux qui découlent d’une exigence réglementaire ainsi que les
gros projets avantageux à long terme, conformément à la politique approuvée
dans le Plan financier à long terme financé par l’impôt foncier ;
c) Que les soldes des fonds de
réserve des services d’eau et d’égout soient versés dans un seul fonds de
réserve ;
d) Que le fonds de réserve combiné
des services d’eau et d’égout maintienne un solde minimal de 20 millions
de dollars ;
e) Que le tarif des services d’eau
et d’égout pour l’année 2005 augmente de 9 p. 100 (hausse du tarif
des services d’eau de 12 p. 100 et réduction de la surtaxe d’égout de
4 p. 100) ;
f) Que, dans le but d’assurer une
viabilité à plus long terme des programmes financés par la tarification de
services, le Conseil municipal souscrive à des augmentations nettes annuelles
du tarif des services d’eau et d’égout de 9 p. 100 pour 2006 et 2007
et de 5 p. 100 de 2008 à 2014, sous réserve de l’approbation des
budgets annuels.
EXECUTIVE SUMMARY
This report identifies the nature and magnitude of the financial challenges facing the water and sewer programs of the City of Ottawa. It outlines the major components that cause financial pressures, and aligns infrastructure requirements and funding levels in the immediate and long term in order to maintain current levels of service.
At the current rate of funding and based on the
capital requirements identified over the next 10 years, both the water and the
sewer reserve funds will be depleted within the next few years.
The following principles for consideration in this report are considered a step towards implementing a sustainable strategy for bridging the $43 million capital funding gap:
- annual Pay-as-you-go contributions be indexed in accordance with the Infrastructure Price Index as published by StatsCan;
- long term debt financing be limited to specific project types – growth, development charge financed and major projects with long term benefits;
- Water and Sewer Reserve Funds be combined into one reserve fund to provide additional financial flexibility;
- Water Rate and Sewer Surcharge be adjusted to meet long term needs.
These principles result in the following recommended funding adjustments:
Water
Fund
- Debt Financing for Water Fund Projects as follows:
o City share of Growth Projects all years
o WPP Waste Management Project in 2005
o Lemieux Island Transmission Mains in 2005 and 2006
o WPP Disinfection Improvements in 2009
- Water rate increase in 2005 of 12%
Sewer
Fund
- Debt financing for City share of growth projects only
- Sewer surcharge decrease in 2005 of 4% to mitigate increase on total bill to 9%
Beyond 2005, for the longer term sustainability of rate supported programs, it is recommended that there be net annual water and sewer rate increases of 9% for 2006 and 2007, and 5% for 2008 to 2014, subject to annual budget approval.
RÉSUMÉ
Le présent rapport porte sur la nature et l’ampleur des défis auxquels fait face la Ville d’Ottawa en ce qui touche le financement de ses programmes d’eau et d’égout. Il définit les principaux éléments qui entraînent des pressions financières et énonce les besoins en infrastructure en fonction des niveaux de financement à court et à long terme nécessaires au maintien des services actuels.
Si l’on tient compte du taux de financement actuel et des immobilisations qui seront requises au cours des dix prochaines années, les fonds de réserve des services d’eau et d’égout seront épuisés d’ici quelques années.
Les principes suivants, lesquels sont examinés dans le présent rapport, visent à mettre en œuvre une stratégie économique viable pour combler les 43 millions de dollars qui manqueront dans les fonds d’immobilisations :
- indexer les contributions par répartition annuelles en fonction de l’indice des prix d’infrastructure publié par Statistique Canada;
- réserver le financement par emprunt à des types de projet précis, soit ceux destinés à faire face à la croissance, ceux qui sont financés à même les redevances d’exploitation, ceux qui découlent d’une exigence réglementaire ainsi que les gros projets avantageux à long terme;
- verser les fonds de réserve des services d’eau et d’égout dans un seul fonds de réserve afin d’accroître la marge de manœuvre financière de la Ville;
- rajuster le tarif du service d’eau et la surtaxe d’égout pour pouvoir répondre aux besoins à long terme.
Ces principes découlent des rajustements du financement recommandés suivants :
Fonds de réserve du service d’eau
- Financement par emprunt des projets réalisés à partir du fonds de réserve du service d’eau :
o participation de la Ville au financement des projets liés à la croissance – chaque année;
o projet de gestion des déchets des usines de purification de l’eau – 2005;
o remplacement des conduites principales de l’usine de purification de l’eau de l’île Lemieux – 2005 et 2006;
o amélioration des mesures de désinfection des usines de purification de l’eau – 2009.
- Hausse du tarif du service d’eau de 12 p. 100 en 2005.
Fonds de réserve du service d’égout
- Financement par emprunt des projets liés à la croissance seulement.
- Réduction de la surtaxe d’égout de 4 p. 100 en 2005 visant à limiter la hausse totale du tarif à 9 p. 100.
Après 2005, il est recommandé que, dans le but d’assurer une viabilité à plus long terme des programmes financés par la tarification, la Ville souscrive à des augmentations annuelles nettes du tarif des services d’eau et d’égout de 9 p. 100 pour 2006 et 2007 et de 5 p. 100 de 2008 à 2014, sous réserve de l’approbation des budgets annuels.
BACKGROUND
Over the past several years, there have been numerous reports, both internal and external to the City of Ottawa that document the funding gap between true full life cycle costs of municipal infrastructure and the level of available funding sources. In October 2002, Council approved the City’s first Long-Range Financial Plan: First Steps (LRFP 1). The LRFP 1 identified a funding shortfall in the City’s capital program and concluded that without additional funding, the City’s capital program could not be afforded. As a result, Council endorsed a number of policy recommendations with the intent of moving towards sustainability.
In October 2003, Council endorsed the Department’s Integrated Asset Management Strategy for Public Works Infrastructure. The goal of the strategy is to deliver policy, process and tools necessary to sustain infrastructure assets that deliver an acceptable level of service at optimal lifecycle costs, while maintaining their condition at a sustainable level and at an acceptable level of risk over their useful life. The Strategy confirmed a shortfall for water and sewer related infrastructure estimated at $43 million per year. The Strategy identified a number of recommendations, including the need to refine long-term forecasted capital needs, review capital standards and develop funding strategies that support these needs.
In 2004, efforts were focused on validating the infrastructure reinvestment deficit, refining the long term forecasted capital needs, identifying the growth component associated with the planned renewal program through the Development Charges Review, and completing the Capital Standards Review that was presented recently to the Planning and Environment Committee and the Transportation Committee. These initiatives have contributed to refine what is required to achieve sustainability for the City’s water and sewer related infrastructures.
This report identifies the nature and magnitude of the financial challenges facing the water and sewer programs of the City of Ottawa. It outlines the major components that inflict the financial pressures, and begins the process of aligning infrastructure requirements and funding levels in the immediate and long term in order to maintain current levels of service. The principles for consideration in this report and the Long Range Financial Plan are considered a step towards implementing a sustainable strategy for bridging the funding gap.
DISCUSSION
Rate Supported
Infrastructure
The City operates one of the largest and most
complex water and wastewater systems in the Province.
To deliver drinking water services, the City relies
on a complex interconnected network of 2 water treatment plants, 14 pumping
stations, 7 reservoirs and approximately 2,600 km of water distribution mains
to deliver potable drinking water to the 700,000 customers of the City’s
central and 4 communal drinking water systems.
Regarding wastewater, the City is serviced by
approximately 2,300 km of sewage collection pipes, 76 lift stations and 1
wastewater treatment facility treating in the order of 420 million litres on an
average day.
Finally, in terms of storm
water, the City is serviced by approximately 1,950 km of storm sewers, 12 storm
water pumping stations and 175 storm water management facilities.
The following table provides a summary of the
replacement value for the existing water and sewer assets.
|
Asset Description |
Replacement Value 2004 $ |
|
Sanitary -
2,340 km piped sanitary and combined sewers -
1 treatment plant -
80 pumping stations |
$3.3B |
|
Water -
2,600 km piped watermains -
2 purification plants - 25 booster stations and reservoirs |
$3.4B |
|
Storm -
1,900 km piped storm sewers -
150 storm water management ponds |
$2.4B |
Estimated Replacement Value
|
$9.1B |
Regulatory Changes
The water and wastewater industries are in the midst of an unprecedented period of regulatory changes. In the immediate post-Walkerton period, the focus of the changes in the drinking water industry has been directly around drinking water quality. These changes occurred through the Safe Drinking Water Act and the Drinking Water Protection Regulations. Most municipalities, including Ottawa, have made the treatment and distribution system modifications necessary to accommodate these changes.
However, there remain a number of very significant changes in the regulatory framework of the industry about which little is known as of yet. The province is still developing the requirements beyond the current conceptual framework.
The most fundamental of these changes is outlined in the Sustainable Water and Sewage Systems Act, otherwise known as Bill 175. This Act, although passed in 2003, has not yet had any supporting regulations developed. However, at the level of the Act itself, compliance will require the development of a Cost of Service Report for water and wastewater/stormwater services, detailing the full cost of providing these services. These reports will then become the basis of developing the Cost Recovery Plan, which will determine the manner in which the full cost of providing these services can be recovered. Details of Bill 175 and the anticipated implications on the management of the City’s water and sewer operations was presented to Council in 2002 (ACS2002-TUP-UTL-0035).
The Province has recognized the significance of these changes and announced the formation of a Water Expert Panel, in August 2004. This Panel has been mandated to report on a number of issues that bear directly on long term investment and financing strategies. Based on recent discussions with members of the Water Expert Panel, its report is to be made public at year-end or early in 2005, and it is expected that the Bill 175 supporting regulations will be developed in 2005 based on the Panel’s recommendations. Given the scope of the broad mandate of this Panel, it is clear that its report has the potential of having significant impact on the manner in which water and sewer services are delivered as well as how they are financed.
More recently, the Province has begun consultation on another key recommendation of the Walkerton Inquiry, and that is the mandatory development and implementation of both Operational Plans and Quality Management Systems. The Operational Plans will be similar to the more widely recognized ISO 9000 and 14000 standards. It is expected that this standard will become a regulated requirement with third party verification of a service provider’s compliance with the Quality Management Standard. While details on this requirement have not yet been developed, it is expected that they will become available in 2005, with large-scale service providers, such as Ottawa, required to have implemented these standards, likely in 2006.
Other anticipated costs of
service impacts due to regulatory change are expected as a result of both the
Nutrient Management Act and the Source Water Protection Act. Again, too little
information is known at this time on these bills to be able to forecast budgetary
impacts, other than to expect increased costs of service.
Capital and
Operational Needs
In order to provide water and sewer services,
there is cost to operate the existing systems and a cost to
maintain/rehabilitate the existing infrastructure that supports the delivery of
the service. In terms of operating
costs, the following table provides a summary of 2004 revenues and
expenditures:
|
|
Water |
Sewer |
|
Revenues -
water and sewer billing -
fire supply charges -
investments and operating revenue |
$59.0M $11.4M $6.0M |
$96.4M - $5.8M |
|
|
$76.4M |
$102.2M |
|
Expenditures -
operating programs -
contributions to capital -
Fiscal charges (debt servicing) -
Fiscal charges (corporate overhead) |
$34.9M $28.4M $0.4M $12.7M |
$32.4M $33.4M $13.5M $22.9M |
|
|
$76.4M |
$102.2M |
There are a number of pressures on the City
resulting in increased costs of delivering the service, namely:
-
new
infrastructure to manage as a result of growth;
-
aging
infrastructure requiring increased maintenance which has been compounded by
deferred rehabilitation of the systems resulting in increased frequency and
number of repairs
-
inflation
on hydro, chemicals, fuel, steel, compensation
-
changes
to the regulatory framework resulting in process adjustments
In order to offset $6 million of net operating
pressures, on 27 October 2004 Council supported a direction for a 4% water rate
increase in 2005 to cover increased costs of providing the current
services. No adjustments were
recommended to the sewer surcharge, although the surcharge is calculated as a
percentage of the water rate. Council
also approved that the Pay as you go contributions be indexed with the City’s
Infrastructure Price Index which amounts to an additional $1.5 million, or a 1%
rate increase.
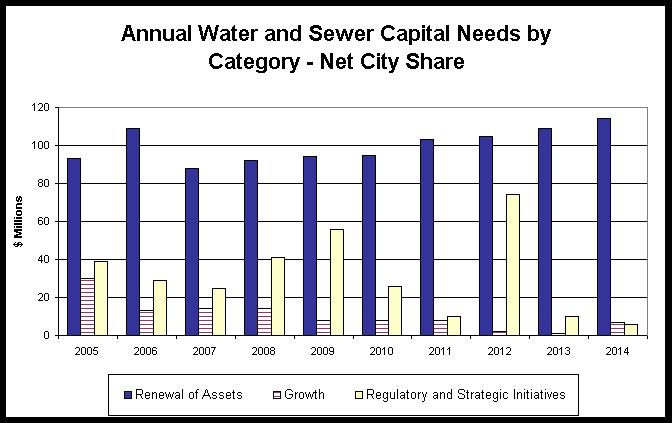
In terms of capital needs, the requirements are
defined in four areas:
-
renewal
of existing infrastructure assets
-
the
City’s contribution to growth related projects that have a benefit to existing
users (e.g. Lemieux and Britannia water purification plant expansions, storage
reservoir expansion, ROPEC expansion, new storm water management ponds)
-
Regulatory
requirements (e.g. water purification plant waste management provisions,
biosolids process modifications, Somerset Wastewater Storage Facility)
-
Strategic
initiatives (e.g. water purification plant disinfection improvements)
A summary of the capital needs for the 10-year
period (2005-2014) is presented in the table below and the annual breakdown is
included in Annex 1.
|
Category |
Gross |
Net |
||
|
Water |
Sewer |
Water |
Sewer |
|
|
Renewal
of water and sewer assets |
$503M |
$501M |
$503M |
$501M |
|
Regulatory
requirements |
$28M |
$131M |
$28M |
$131M |
|
Growth |
$135M |
$478M |
$11M |
$90M |
|
Strategic
initiatives |
$86M |
$70M |
$86M |
$70M |
|
|
$752M |
$1,180M |
$628M |
$792M |
In the determination of the renewal needs, and more specifically on the linear infrastructure, the methodology is based on reinvestment requirements as a function of replacement value of the assets that are required to sustain the service to current service levels. These rates are shown in the table below.
|
Asset Type |
Replacement Value (2004 $) |
Reinvestment Rates Based
on 2003 Asset Management Strategy (linear) |
Current Average
Reinvestment Rate (2001-2004) |
2004 LRFP Reinvestment
Rate (2005-2014) |
|
Watermains |
$2.9B |
1.2
– 1.8% |
0.9% |
1.1% |
|
Sanitary
sewers |
$2.5B |
0.7
– 2.0% |
0.8% |
0.9% |
|
Storm
sewers |
$2.3B |
0.7
– 2.0% |
0.4% |
0.7% |
There is an important distinction in the rates presented in the 2003 Asset Management Strategy and those recommended as part of the 2004 LRFP. As part of the 2003 Asset Management Strategy, the deficit for the linear infrastructure was determined based on using a straight line deterioration model and provided a range of reinvestment requirements based on industry benchmarks. By doing so, it assumed that the infrastructure deteriorated at a constant rate over its useful life. This has been the traditional method of measuring depreciation for many municipalities because long-term needs can be estimated with only basic inventory and cost information and the methodology has the additional advantage of being simple. It does not, however, present a very accurate picture of an asset’s true needs, nor does it recognize a utility’s true position within its lifecycle.
In 2004, the Department focused
on refining depreciation modeling by using a non-linear approach. With non-linear depreciation,
detailed inventory information like length, materials and age data is used to
increase the accuracy of lifecycle modeling.
Non-linear depreciation also takes into account operational and
maintenance activities that contribute to the asset’s longevity. As a result, while the 2003 Asset Management
Strategy rates are assumed to apply for the life of the assets, the LRFP 2
reinvestment rates are only reflective of the 10-year LRFP 2 period (2005-2014)
and the rates will change with time based on the characteristics of the City’s
linear assets. While the rates are
currently at the lower end of the ranges provided in the 2003 Asset Management
Strategy, these are forecasted to increase in the coming years.
Finally,
in the context of a long range plan, the needs are identified at a network
level in terms of how many pipes needs to be replaced on an annual basis and
not at a specific project level. The
project specifics are defined as part of the annual capital budget process and
the determination then becomes subject to site specific condition assessments
which are a function of detailed condition, performance, age, material,
coordination with other projects, and so on.
Historical Rate Levels
Currently, the rate is comprised of two
components and users are charged based on the municipal services received:
-
For
water users, a water rate expressed in terms of a cost per cubic metre of water
used; and
-
For
sewer users, a sewer surcharge expressed in terms of a percentage of the water
rate.
At the end of the year, any water or sewer revenues remaining are directed to separate water and sewer reserve funds to be used to fund projects in subsequent years. In terms of stormwater, it is recognized that the sewer surcharge bears little relationship to the amount of stormwater generated by a particular property. However, this practice is not uncommon and has been in use for some time.
With the exception of a one-time increase in 2002, and an inflationary increase in 2004, the City of Ottawa water rate has not increased over the past 11 years. A decrease was approved in 1997. Overall, the rate has increased only 1.4% since 1994, and has therefore not even kept pace with inflation.
|
Year |
Cost of Water per Cubic Meter |
|
1994 – 1996 |
$0.515 |
|
1997 – 2001 |
$0.495 |
|
2002 – 2003 |
$0.565 |
|
2004 |
$0.585 |
Similarly, the sewer surcharges collected by the Region and former municipalities prior to amalgamation did not increase over the period 1994 to 2000. The sewer surcharge in the former municipalities serviced by the municipal sewer system varied between 100% and 167.5% and the rates were generally reflective of the age of the sewer assets in that particular municipality. As part of the amalgamation process, the surcharge rates were harmonized in 2001 and set at 166%. This harmonization constituted an increase to the sewer surcharge in all former municipalities with municipal sewer services, with the exception of the former City of Ottawa. The increase was phased-in over a period of three years for Gloucester, Kanata, Cumberland, West Carleton and Goulbourn. The sewer surcharge has not subsequently been increased.
Cost of Service
Comparison
The comparison of water and sewer rates between cities is a difficult one to achieve in a meaningful manner because of the differences in levels of government (single tier, multiple tier) and the many varied means and methods of invoicing for these services (flat rate, flat charge, variable block rates, etc). The most effective manner is to compare actual service delivery costs within a service delivery area. BMA Management Consulting Inc. has prepared a thorough review of various service charges of Ontario municipalities. BMA Consulting undertook this review on behalf of 61 participating Ontario municipalities, including Ottawa. For comparison purposes, we have selected a number of municipalities of similar size and complexity to Ottawa. A summary of combined residential water and wastewater service charges are shown in the table below.
This actual service costs information is based upon 2003 service rates, the latest year in which information is available. We have added information relating to approved rate changes in the following two years via informal telephone and Internet surveying.
From the table below, it is noted that Ottawa is currently near the provincial average. While there are municipalities below Ottawa and the provincial average, it is evident with the ongoing changes to the regulatory framework and the recognition of significant infrastructure deficits amongst most municipalities that the funding levels will need to increase. Many municipalities have already identified significant increases over the coming years in order to cover the capital and operating costs, including Toronto that is projecting a 62% increase over the next 10 years. The cost of service in the table below is therefore expected to change significantly over the coming years as municipalities adjust to the new realities.
|
Municipality |
Residential Average* (2003$ per year) |
Rate Increase
|
|
2004
|
2005
|
||
|
$810 |
10% |
10% |
|
|
London |
$684 |
Water 3% and Wastewater 7.4% |
To be determined. |
|
$589 |
9.5% |
8.1% |
|
|
Ottawa |
$573 |
3% |
|
|
Kitchener |
$539 |
Water 12% and Wastewater 27% |
To be determined. |
|
Hamilton |
$517 |
9.5% |
To be determined. |
|
Oshawa |
$509 |
Water 6% and Wastewater 8% |
Projected as Water 2-4%, Wastewater 7-9% |
|
Richmond
Hill |
$479 |
5% |
To be determined. |
|
Toronto |
$422 |
6% |
6% |
|
Mississauga |
$304 |
5% |
To be determined. |
|
Ontario
Average |
$553 |
|
|
|
Ontario
Minimum |
$297 |
|
|
|
Ontario
Maximum |
$949 |
|
|
* Source: BMA Management Consulting
Inc.
Funding Sources
Funding sources to cover capital, operating and
maintenance costs for the water and sewer systems include:
-
water
rate: based on water consumption
-
sewer
surcharge: based on a percentage of the water consumption
-
fire
supply charge: based on areas with fire protection
-
development
charges: to cover capital infrastructure projects with a growth component
-
GST
rebate: new revenue source from the Federal Government
-
debt
financing
-
water
and sewer reserves: to cover annual fluctuations in capital requirements
At the current rate of funding and based on the
capital requirements identified over the next 10 years, both the water and the
sewer reserve funds will be depleted early within this timeframe.
Strategies to Achieve
Sustainability
System Efficiencies
A major part of a strategy to achieve
sustainability is ensuring that the assets and the funding that are available
are managed in the most efficient way possible. The Department’s Integrated Asset Management Strategy is a
foundation piece in terms of achieving this sustainability as it provides a
framework that is defendable and repeatable in terms of the management of the
City’s infrastructure assets. The strategy provides the City with the tools
it needs to be able to prioritize lifecycle projects, lower lifecycle costs,
better manage risk and establish publicly accepted service levels for the
City’s water and sewer assets. In addition, the Capital
Standards Review completed recently identifies a number of opportunities to
minimize the lifecycle cost of these assets.
The initiatives linked to the consideration of these opportunities are
in various stages of implementation.
Since the water and sanitary sewer systems are sized based on consumer consumption, there is a benefit to decreasing the usage in order to maximize current infrastructure investments. The City formally recognized the need for action on this matter in the 2003 Infrastructure Master Plan. In June 2004, the Department presented to Council details of the 2004 Water Efficiency Pilot Program. The outcome of the 2004 pilot is expected to contribute to the development of the city-wide program to be initiated in future years.
The Water Efficiency Program and
associated public awareness campaign encourages residents to use water wisely
and at the right time to reduce peak use.
Municipal water infrastructure is designed to meet a number of critical
demand scenarios, and the peak summer demand which occurs only a few days per
year typically defines the capacity of the infrastructure. Measures that reduce those peaks can have an
immediate beneficial impact by decreasing the cost of service delivery and
deferring capital expenditures.
Combined Water and Sewer
Reserve Fund
As previously noted, the City’s water and sewer programs are funded in part by a water rate and a sewer surcharge. Bill 175: Sustainable Water and Sewer Act confirms the legislated requirement for funds separate from the tax funds, but does not define a requirement for separate water and sewer reserve funds. A recommendation of this report is to combine the water and sewer reserve funds. This recommendation is intended to enhance the financial flexibility of the fund, and to “smooth out” the funding available for significant expenditures in any particular year. For purposes of the analysis in this report, the reserve fund is presented as combined.
Another recommendation pertains to the minimum reserve balance. At this point there is no policy direction from Council that establishes the minimum amount that should be maintained in the rate support reserve fund. With approval of the Long Range Financial Plan – First Steps in October 2002, City Council approved:
Policy Recommendation 6
A policy should be developed to identify the minimum closing annual balance for Reserve Funds to allow for reasonable financial flexibility
The intent of the minimum reserve balance is to maintain an annual contingency for unanticipated emergency or regulatory requirements that may emerge. For City Wide reserve funds, City Council subsequently approved a staff recommendation for a minimum balance of $50 million, but this did not apply to the water and sewer reserve funds.
The recommended rates discussed
below are based on achieving sustainability of the City’s water and sewer
assets by funding the renewal requirements that have been identified through
the Department’s Asset Management Strategy.
As such, this reduces the need for large balances to cover unknowns that
may occur as a result of significant system failures and provides adequate
flexibility to deal with unanticipated requirements that may emerge. At this point, it is recommended that for
the purpose of identifying longer term rate requirements (2005-2014) that a
minimum combined reserve balance of $20 million be maintained. This amount could be reviewed as part of the
next LRFP update to be undertaken prior to the next municipal election at which
time more information will be available on Bill 175. Since the combined reserves for the period up to 2007 are projected
to be in excess of $50 million, the risk associated with this approach is
considered to be reasonable. For
information, the short term impacts on the rates (2005-2009) as a result of
maintaining a larger minimum balance over the longer term (2005-2014) is
provided later in this report.
Debt Financing for
Specific Projects
The Long Range Financial Plan 2 recommends: “Long term debt financing should be restricted to specific project types. Debt financing for lifecycle projects should be reduced and ultimately eliminated. Instead, debt financing should be employed on projects related to capacity expansion or growth, projects financed by development charges, future new non-traditional infrastructure projects tied to third party matching funding.”
For the rate-supported programs, this recommendation supports debt financing of the City’s share of growth projects, and of significant and unique regulatory capital requirements, process modifications, or strategic initiatives that provide long term benefit to the ratepayer. This policy makes the development of a ten-year operating and capital plan achievable without significant “spikes”.
Required Rate Adjustments
As indicated, there are strategies available to ensure long-term financial sustainability of the water and wastewater programs. Prior to recommending a sustainable approach, we will examine the status quo.
Status
Quo
At year-end 2004, the Water Reserve Fund is projecting a balance of $20 million, and the Sewer Reserve Fund $83 million for a combined reserve balance of $103 million.
In 2005, the Water Fund is facing a significant regulatory requirement for completion of the Water Purification Plant Waste Management project in accordance with an order from the Provincial Ministry of the Environment. This project requires 2005 authority of $28 million. The total 2005 net request for all renewal and regulatory requirements is over $80 million. In the absence of additional debt financing, a 2005 water rate increase of 65% is required to fund all requirements. This “rate shock” was forecast in the 2003 Capital Budget, where the Water Reserve Fund projected a deficit position in 2005.
This 2005 water rate increase of 65% could potentially be mitigated by a one-time reduction in the Sewer Surcharge, so that the net impact to the overall bill was approximately 25%, however, due to significant additional requirements on the Sewer Fund in 2006 – 2008 the surcharge would be required to increase again. This is not the recommended approach.
Recommended
Approach
As per the Recommendations and Discussion of this report, the recommended approach includes the following:
Water Fund
- Debt Financing for Water Fund Projects as follows:
- City share of Growth Projects all years
- WPP Waste Management Project in 2005
- Lemieux Island Transmission Mains in 2005 and 2006
- WPP Disinfection Improvements in 2009
- Annual water rate increases in 2005 to 2007 of 12%
- Annual water rate increases in 2008 to 2014 of 5%, assuming today’s projections of annual operating cost and pay-as-you-go increases.
Sewer Fund
- Debt financing for City share of growth projects only
- Annual sewer surcharge decreases in 2005 to 2007 of 4%, to mitigate increase on total bill to 9% for the period.
- No further reduction or increase in sewer surcharge 2008 to 2014, assuming today’s projections of annual operating cost and pay-as-you-go increases.
Impacts and reserve balances over the next 5 years are summarized as follows:
|
Year |
2005 |
2006 |
2007 |
2008 |
2009 |
|
33.5 |
26.5 |
6.5 |
0.1 |
46 |
|
|
Water Rate Increase |
12% |
12% |
12% |
5% |
5% |
|
Water
Rate (per m3) |
$.655 |
$.734 |
$.822 |
$.863 |
$.906 |
|
Surcharge
Impact |
(4%) |
(4%) |
(4%) |
0% |
0% |
|
Sewer
Surcharge |
159% |
152% |
145% |
145% |
145% |
|
$49.00 |
$53.00 |
$58.00 |
$35.00 |
$37.00 |
|
|
Combined
Reserve Balances ($M) |
82 |
63 |
51 |
26 |
35 |
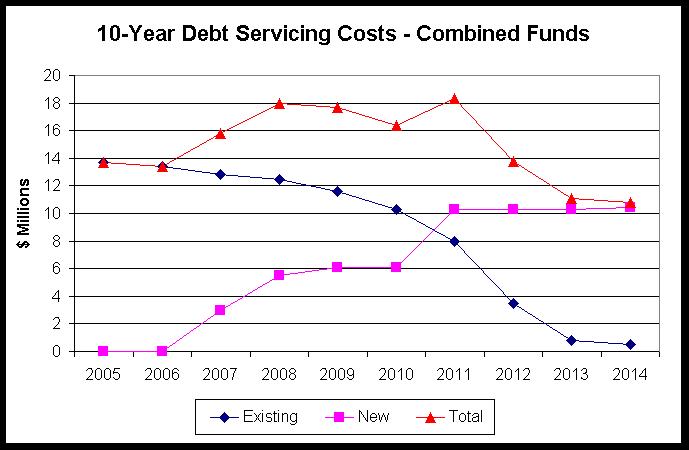
While this recommended approach does increase debt load and resulting debt servicing costs in the short term, this is balanced off over the ten-year horizon as existing debt emanating from the Robert O. Pickard Centre is retired over the period 2010 to 2014. This is presented graphically in Annex 2.
In summary, as noted in the discussion section of this report, on October 27, 2004 City Council directed a 4% increase in the 2005 Water Rate to fund operational requirements only, with no adjustment to the sewer surcharge. As well, City Council endorsed a policy of annual increases to pay-as-you-go contributions equal to the Infrastructure Price Index, or 2.5% for 2005. This equates to an additional 1% water rate increase. Further detailed analysis of capital requirements, both new and deferred, as completed through the Asset Management Strategy and the Long Range Financial Plan 2, dictates that an additional increase to the 2005 water rate is required, that can be partially mitigated by a 2005 sewer surcharge decrease, resulting in an additional increase of 4% on the average water bill, resulting in a net 9% increase. This approach also requires the issuance of limited debt, consistent with the recommendations of the Long Range Financial Plan Sub-Committee.
In the longer term, consistent net increases of 9% are recommended for 2006 and 2007, in order to fund short-term capital requirements, and maintain a minimum combined reserve balance of $20 million. Beyond 2007, it is projected that steady increases of 5% should continue annually to fund operating increases and increased pay-as-you-go contributions.
Alternative Approaches to Maintain Greater Minimum Reserve Balance
Following the presentation to the Long Range Financial Planning Subcommittee on 15 November 2004, concerns were expressed that the recommended approach resulted in significant draw down of the reserve up to 2008, where the projected combined balance is $26 million. As such, the subcommittee approved the recommendations contained in the presentation subject to the provisions of additional scenarios to create a combined reserve balance of up to $90 million.
The request for the $90 million scenario emanated from the discussion that the only benchmark received in all reviews of minimum reserve balances was maintenance of 1% of asset value, which would equate to $90 million for the City of Ottawa. This is not an industry practice for minimum reserve balances, but rather a benchmark for asset reinvestment.
There are numerous scenarios that could achieve the greater reserve balances, with mixes of water rate increases, sewer surcharges adjustments, and additional debt issuance. Examples of two possible scenarios to achieve greater reserve balances are as follows:
For a $50 million reserve balance (as per table below), water rate increases of 12% for each of the next 4 years (2005 to 2008) would be required with mitigating surcharge reductions of 3% resulting in a 10% increase on the average water bill for each of the next four years. In 2009 and beyond, a stable annual increase of 5% would be anticipated.
|
Year |
2005 |
2006 |
2007 |
2008 |
2009 |
|
Water
Rate Increase |
12% |
12% |
12% |
12% |
5% |
|
Water
Rate (per m3) |
$.655 |
$.734 |
$.822 |
$.921 |
$.967 |
|
Surcharge
Impact |
(3%) |
(3%) |
(3%) |
(3%) |
0% |
|
Sewer
Surcharge |
161% |
156.5% |
152% |
147.5% |
147.5% |
|
$54.50 |
$60.00 |
$66.00 |
$72.50 |
$40.00 |
|
|
Combined
Reserve Balances ($M) |
84 |
69 |
63 |
55 |
83 |
For a minimum $90 million balance (as per table below), an example would require water rate increases of 14% in 2005 and 2006, and 8% in 2007 and 2008, with no adjustment in the sewer surcharge. With increases of this magnitude in the short term, no further increase is projected to be required in 2009.
|
Year |
2005 |
2006 |
2007 |
2008 |
2009 |
|
Water
Rate Increase |
14% |
14% |
8% |
8% |
0% |
|
Water
Rate (per m3) |
$.667 |
$.760 |
$.821 |
$.887 |
$.887 |
|
Surcharge
Impact |
0% |
0% |
0% |
0% |
0% |
|
Sewer
Surcharge |
166% |
166% |
166% |
166% |
166% |
|
$76.00 |
$87.00 |
$56.50 |
$61.00 |
$0.00 |
|
|
Combined
Reserve Balances ($M) |
91 |
90 |
97 |
100 |
127 |
Both these scenarios assume debt financing as outlined in this report, but no additional debt financing. Additional debt financing could also be considered to mitigate the short-term rate increases.
As previously noted, the recommended minimum combined reserve balance of $20 million is considered reasonable. This amount could be reviewed as part of the next LRFP update to be undertaken prior to the next term of Council.
FINANCIAL IMPLICATIONS
Financial implications are noted in the report
recommendations and discussion. Subject
to City Council approval, the 2005 Draft Operating and Capital Budgets for the
water and sewer rate supported programs will reflect the availability of funding
as recommended in this report.
SUPPORTING DOCUMENTATION
Annex 1 Annual
Water and Sewer Capital Needs by Category – Net City Share (attached)
Annex 2 10-Year
Debt Servicing Costs – Combined Fund (attached)
The
following reports were issued previously to all members of Council and are held
on file with the city Clerk:
ACS2002-CCV-LRF-0001: City of Ottawa Long Range Financial Plan: First Steps
Province of Ontario Bill 175: Sustainable Water & Wastewater Act
ACS2003-TUP-INF-0021: Integrated Asset Management Strategy for
Public Works Infrastructure
ACS2004-TUP-INF-0009 : Capital Standards Review for PublicWorks
Infrastructure – Final Report
ACS2004-CMR-OCM-0018: 2005 Budget Directions
DISPOSITION
Upon approval this report, staff will table the
2005 Capital Budget based on full funding requirements. Staff will also adjust the water and sewer
billing for 2005 to reflect the adjustments to the water rate and sewer
surcharge. The anticipated
implementation date is 1 May 2005.
Annex 1
Annex 2