Report to/Rapport au :
Joint Agriculture and
Rural Affairs Committee and Planning and Environment Committee
Réunion conjointe des Comités de l'agriculture et des questions rurales
et de l'urbanisme et de l'environnement
20 March 2009 / le 20 mars 2009
Submitted by/Soumis par : Nancy Schepers, Deputy City Manager/
Directrice municipale adjointe,
Infrastructure Services and
Community Sustainability/
Services d’infrastructure et
Viabilité des collectivités
Contact Person/Personne-ressource : Lesley Paterson, Program
Manager/Gestionnaire de programme, Community Planning and
Design/Aménagement et conception communautaire, Planning and Growth
Management/Urbanisme et Gestion de la croissance
(613)
580-2424 x21611, lesley.paterson@ottawa.ca
SUBJECT:
|
COMPREHENSIVE OFFICIAL PLAN
REVIEW - DRAFT OFFICIAL PLAN AMENDMENT - PUBLIC MEETING |
|
|
|
OBJET :
|
RÉVISION DÉTAILLÉE DU PLAN OFFICIEL -
MODIFICATION PROVISOIRE AU PLAN OFFICIEL – RÉUNION PUBLIQUE |
REPORT RECOMMENDATIONS
That
the joint meeting of Planning and Environment Committee and Agriculture and
Rural Affairs Committee:
1.
Hold a Public Meeting on the draft Official Plan
Amendment for the City of Ottawa arising out of the comprehensive five-year
review;
2.
Receive the proposed additions to the draft
Official Plan Amendment (February 2, 2009)
pertaining to Urban Expansion Areas as outlined in this report; and
3. Direct staff to review all written and
oral submissions and directions from Committee and to provide:
a. feedback on all submissions received
orally or in writing; and
b. recommended changes to the draft
Official Plan Amendment; and
c.
a
revised draft Official Plan Amendment
for
consideration when the joint public meeting of Planning and Environment
Committee, and Agriculture and Rural Affairs Committee, resumes on May 11,
2009.
RECOMMANDATIONS
DU RAPPORT
Que le Comité de l’urbanisme et de l’environnement
et le Comité de l’agriculture et des affaires rurales :
1.
tiennent
une réunion publique sur la modification préliminaire du Plan officiel pour la
Ville d’Ottawa dans le cadre de son examen quinquennal exhaustif;
2.
prennent
connaissance des ajouts proposés dans le cadre de la modification préliminaire
du Plan officiel (le 2 février 2009) au sujet des zones d’étalement
urbain telles que décrites dans le présent rapport;
3.
demandent
au personnel d’examiner toutes les demandes et les directives reçues à l’oral
ou par écrit du Comité et de fournir :
a. une
rétroaction sur toutes les demandes reçues à l’oral ou par écrit;
b. la
recommandation de changements à la modification préliminaire du Plan officiel;
c.
une
version révisée de la modification préliminaire du Plan officiel;
aux fins d’examen lors de la prochaine réunion
publique conjointe du Comité de l’urbanisme et de l’environnement et du Comité
de l’agriculture et des affaires rurales prévue le 11 mai 2009.
REPORT RECOMMENDATION
That the joint meeting of Planning and Environment
Committee, and Agriculture and Rural Affairs Committee:
1. Hold
a Public Meeting on the draft Official Plan Amendment for the City of Ottawa
arising out of the comprehensive five-year review; and
2. Direct
staff to review all written and oral submissions and directions from Committee
and to provide:
a. feedback
on all submissions received orally or in writing; and
b. recommended
changes to the draft Official Plan Amendment; and
a
revised draft Official Plan Amendment
for consideration when the joint public meeting of
Planning and Environment Committee, and Agriculture and Rural Affairs
Committee, resumes on May 11, 2009.
RECOMMANDATION DU RAPPORT
BACKGROUND
This is the Public Meeting required under the Planning Act for all Official Plan Amendments. The intention is that once all the presentations have been made, the public meeting will be adjourned for a few weeks to allow staff to respond to the submissions and revise the draft Official Plan Amendment as required. The public meeting will resume on May 11, 2009 with that additional material having been made available in advance. Committee will not make decisions on the draft Official Plan Amendment until the revised amendment is provided in May.
Also, by way of this report, staff is providing an important addition to the proposed comprehensive amendment related to urban expansion areas.
DISCUSSION
The draft Official Plan Amendment was tabled with a joint meeting of Planning and Environment Committee and Agricultural and Rural Affairs Committee on February 2, 2009 (http://www.ottawa.ca/calendar/ottawa/citycouncil/ara/2009/02-02/jointagendaindex1.htm). It was placed on technical circulation on February 13 and public circulation on February 17, 2009. Preliminary proposed policies were available for review in April 2008 and revised policies in November 2008. Staff also held public information meetings on the proposed changes in various locations throughout the city as required by the Planning Act. To date, a number of written submissions have been made to the City and these have been made available to Councillors. They are also available in the City Clerk’s Office.
Staff have identified the need for an additional 850 gross hectares of urban residential land. At the time that the draft Official Plan Amendment was circulated, it did not contain specific policies or recommendations on the proposed urban expansion areas. The candidate areas had been identified and explained, and a preliminary review had been completed. Since that time:
· Consultants have done more in-depth analysis of the servicing requirements;
· Staff have received some comments on the proposed criteria and the weight given to the criteria that have resulted in their reconsideration; and
· Staff have done a careful review of the figures.
This work has led to a revision of the relative scores and recommendations for inclusion in the urban area.
The way in which these lands would be provided for in the Official Plan was not discussed previously. The primary interest of the City is that various works be undertaken and commitments made before urban status is placed on these lands. That is the basis of the proposed amendment attached as Document 1. The evaluation of candidate areas is attached as Document 2.
This proposed addition to the comprehensive amendment has been placed on circulation in order to meet the timeframe of the continuation of the public meeting on May 11, 2009.
CONSULTATION
The public meeting is a requirement of the Planning Act as part of the formal public consultation on the proposed Official Plan Amendment.
LEGAL/RISK MANAGEMENT IMPLICATIONS:
There are no legal/risk management implications with respect to this report.
FINANCIAL IMPLICATIONS
There are no financial implications of holding a public meeting.
SUPPORTING DOCUMENTATION
Document 1 Proposed Addition to Draft Official Plan Amendment, Urban Expansion Areas
Document 2 Evaluation of Candidate Urban Expansion Areas.
DISPOSITION
Once Council has adopted the Official Plan Amendment, staff will prepare a “record” for submission to the Minister of Municipal Affairs, along with the request for approval.
PROPOSED OFFICIAL PLAN AMENDMENT, URBAN
EXPANSION AREA DOCUMENT 1
A draft Official Plan Amendment resulting from a comprehensive five-year review was circulated on February 2, 2009. The Public Meeting required under the Planning Act has been scheduled in two parts. It will begin on March 31, 2009 and will resume again on May 11, 2009. This document is an addendum to the draft Official Plan Amendment circulated on February 2, 2009 and will also be circulated in order to provide for written and oral submissions by May 11, 2009.
The evaluation of candidate urban areas for expansion is found in Document 2.
The proposed additions to the draft Official Plan Amendment are as follows:
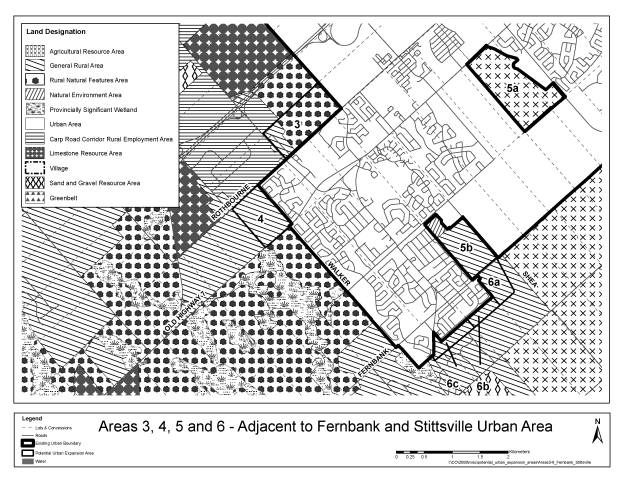
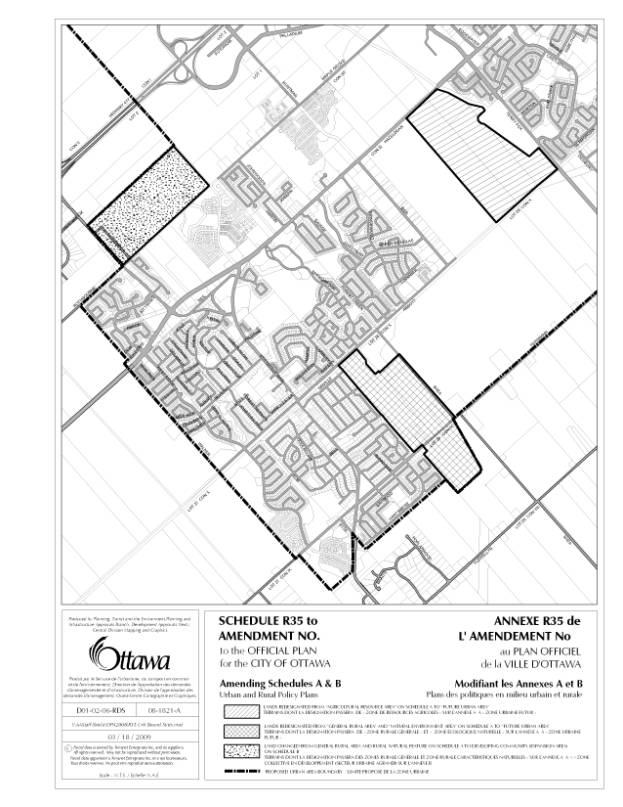
1. The areas wholly within the boundaries of the Fernbank Community Design Plan are designated “Future Urban Area” (consistent with the remainder of the Fernbank Community Design Plan lands) in order that they be recognized as Urban Area and part of the Community Design Plan process. These are the areas formerly known as candidate parcels 5a and 5b (see Schedule R35).
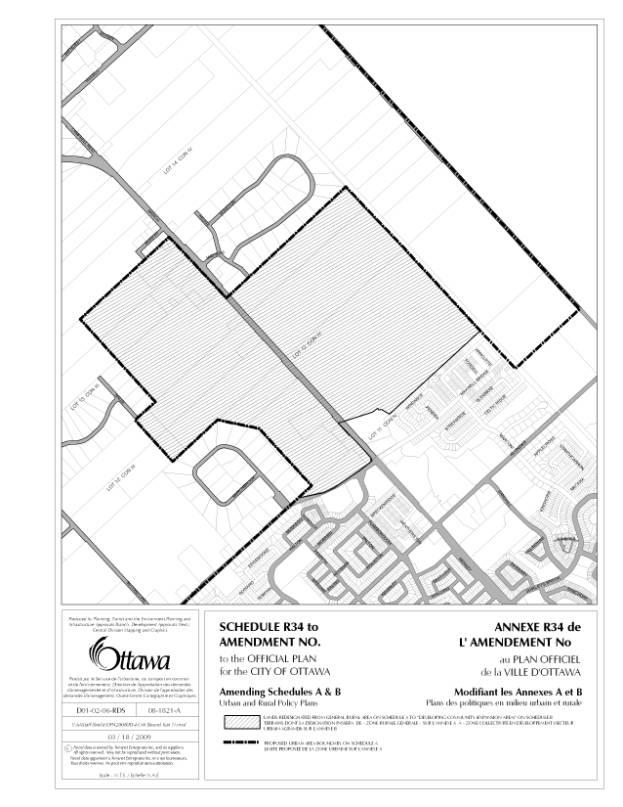
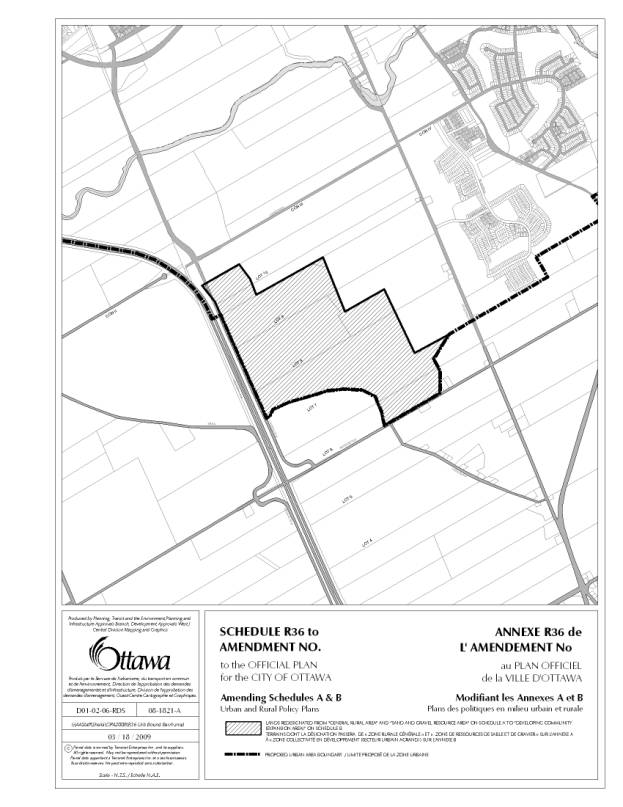
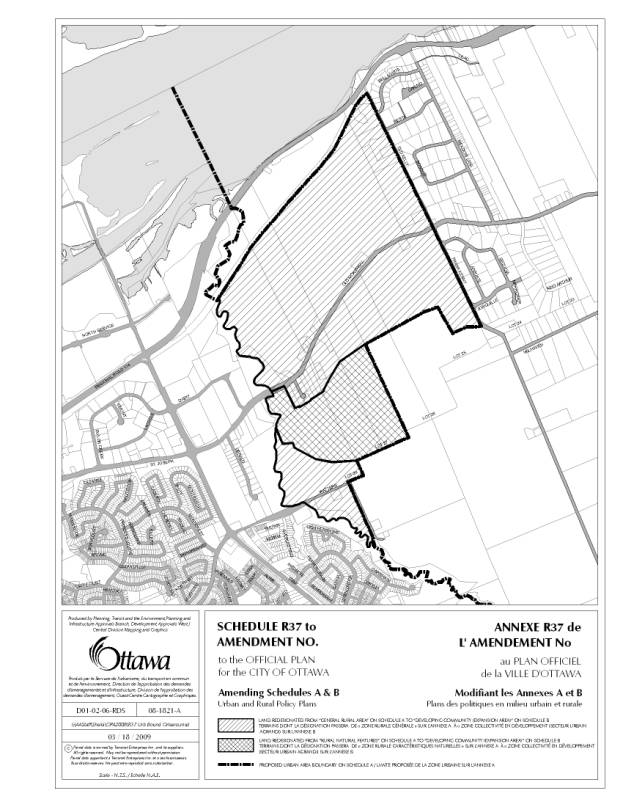
2. Various other areas are designated as “Developing Community (Expansion Area)” (see Schedules R34, R36, and R37).
3. A new Section 3.12 is added to the Official Plan:
3.12 –
Developing Community (Expansion Area)
The designation of Developing Community (Expansion Area) on Schedule B and Urban on Schedule A allows for sufficient urban land to support the residential demands of the projected population. These lands, none of which is very large, will develop primarily for residential purposes, although minor, non-residential uses to meet the needs of a neighbourhood may also be located here.
1. Lands are designated on Schedule B as ‘Developing Community (Expansion Area)’ with the intent that these lands will be developed primarily for urban residential uses, once the policies of this section have been satisfied.
2. The type of study and development plan required to achieve the policies of this section will be agreed to in advance and may be a community design plan, a concept plan or a plan of subdivision.
3. Proponents of development will complete, to the satisfaction of the City, studies and a plan of sufficient detail to:
a. Identify the location, timing and cost of roads and transit facilities, water and wastewater services, public utilities, and stormwater management facilities, etc. required on-site and off-site to service the area; and
b. Identify the natural heritage system on the site independent of the potential developable area. Typically an environmental management plan as described in Section 2.4.2 will be prepared where a subwatershed study does not exist or does not provide sufficient guidance to identify the environmental features on the site and their functions, which together constitute the natural heritage system. The components of this system are generally described in Section 2.4.2, with the exception that significant woodlands are to be further evaluated consistent with the Urban Natural Areas Environmental Evaluation Study. No development is permitted within this system, which is to be conveyed to the City for public use before development of the area is approved; and
c. Identify Recreational Pathways on the site; and
d. Evaluate the adequacy of community facilities existing or planned for the area: and
e. Include a Financial Implementation Plan to show how the following will be secured at no cost to the City:
1. The on-site and off-site servicing systems described above; and
2. The natural heritage system; and
3. Implementation of Recreational Pathways as identified in this Plan; and
4. Improvements to community facilities, if required.
f. Show how the plan will achieve other policies of this Official Plan including, but not limited to, housing mix and densities and affordable housing; and
g. Meet the requirements of Phase 1 and 2 of the Environmental Assessment Act where required.
4. Where the development plan impacts multiple landowners, it is their responsibility to collaborate on the preparation of the plan and to agree on how parks, stormwater ponds and any other facilities will be located and costs shared.
5. An amendment to this Plan will not be required to remove the designation of Developing Community (Expansion Area) and replace it with General Urban Area, but an amendment may be required to implement infrastructure and open space provisions of plans approved for individual areas. Development may proceed once the City is satisfied that the requirements of this section have been met and the development plan has been approved by the City.
EVALULATION OF CANDIDATE URBAN
EXPANSION AREAS DOCUMENT
2
Background
The Residential Land Strategy for Ottawa, 2006 to 2031, identifies a need for some additional urban lands to the year 2031. The recommendation is for an additional 850 gross hectares of urban residential land through an urban boundary adjustment in the updated Official Plan. The intent of the expansion is to add small amounts of urban land to the boundary in a number of locations and thereby use residual capacity in existing infrastructure and provide the highest probability of integration with the existing community. The purpose of this summary is to present information for each candidate area and to recommend appropriate locations for changes to the urban boundary.
The recommended expansion areas are based on balancing various considerations:
· The availability of land in a non agricultural designation
· The expected absorption rate in various areas
· The relative merit of each parcel based on a number of evaluation criteria
|
Table 1: Additions to the Urban Area, 1987 to 2009 |
|||
|
|
|||
Year
|
Ha added |
Gross Ha |
|
|
1987 |
|
31,815 |
|
|
1988 |
183.0 |
31,998 |
Land
added in Kanata North (ROPA's 73 & 74 to 1974 Regional OP) |
|
1988 |
26.0 |
32,024 |
Salvation
Army site, southwest of 417 and Terry Fox, ROPA
75 |
|
1988 |
16.0 |
32,040 |
Land
southeast of Innes & 10th Line, ROPA 79 to 1974 ROP |
|
1989 |
567.9 |
32,608 |
Leitrim
added at adoption of 1988 ROP (not including wetland) |
|
1990 |
1245.0 |
33,853 |
Orleans
Expansion added through ROPA 1 to the 1988 ROP |
|
1992 |
40.0 |
33,893 |
Palladium,
ROPA 8 to 1988 ROP |
|
1994 |
2.1 |
33,895 |
St.
John's Anglican Church, north Kanata, ROPA 43 |
|
1995 |
12.5 |
33,908 |
Goulbourn
Recreation Complex added to Stittsville, ROPA 48 |
|
1996 |
202.0 |
34,110 |
Kanata
North Expansion Area added through ROPA 41 |
|
2000 |
685.0 |
34,795 |
Kanata
West added through ROPA 9 to the 1997 ROP |
|
2001 |
- |
34,795 |
Size
of urban area at amalgamation |
|
2006 |
470.6 |
35,265 |
Del-Brookfield-Westpark
added (Board order in 2006) |
|
2009 |
795.0 |
36,060 |
Proposed
additions |
|
Total 1987 to 2006 |
3450.1 |
|
Increase
from 1987 = 10.8% over 19 years |
|
Total 1987 to 2009 |
4300.0 |
|
Increase
from 1987 = 13.5%% over 22 years |
Methodology
Identification of Candidate Areas
A number of assumptions guided the identification of candidate areas for analysis:
- The parcels must be a logical extension of the existing urban area;
- No lands in an Agricultural Resource Area designation were considered (with the exception of areas 5a and 10d,e discussed later). The Provincial Policy Statement and the Official Plan are very clear that expansion of urban uses into Agricultural Resource Areas may only be considered if there are no reasonable alternatives that avoid Prime Agricultural Areas. Since staff have identified more than 2,000 hectares of non-agricultural land as candidate areas, there is no need to look elsewhere.
- No lands in a Natural Environment Area designation were considered;
- Some Sand and Gravel Resource lands were included in the candidate areas, on the assumption that the resources would be depleted within the planning period.
- Virtually all lands in a General Rural Area designation abutting the existing Urban Area were included. The only exceptions were General Rural Area lands that had no residential potential due to aircraft noise or proximity to the Trail Road solid waste disposal site.
Secondly, the areas were screened based on the presence of Natural Heritage System components. Focus was placed on forested areas, wet areas, escarpments and valleylands. This information was used to understand the availability of developable land within the study area and to profile the possibility of securing these lands through the process at no cost to the City. Such natural heritage features were not included in the definition of “gross developable” residential hectares.
Gross hectares identified: 2035
Gross developable hectares identified: 1537
Gross developable residential hectares required: 850
The purpose of the evaluation is to identify the specific 850 ha to be recommended for inclusion in the urban area, from among the 2035 ha initially identified.
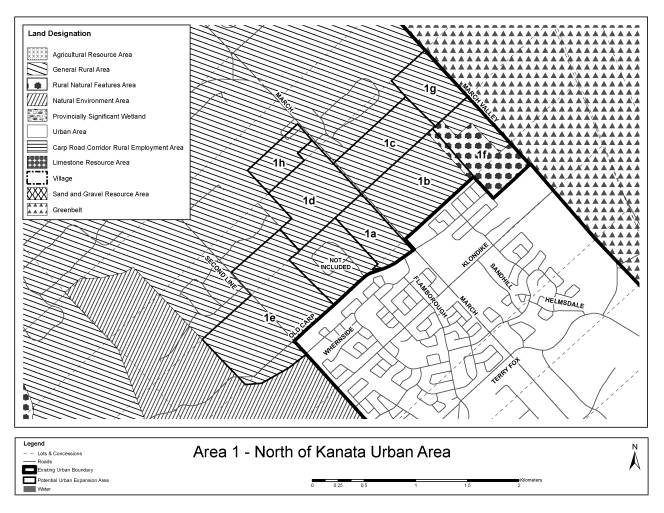
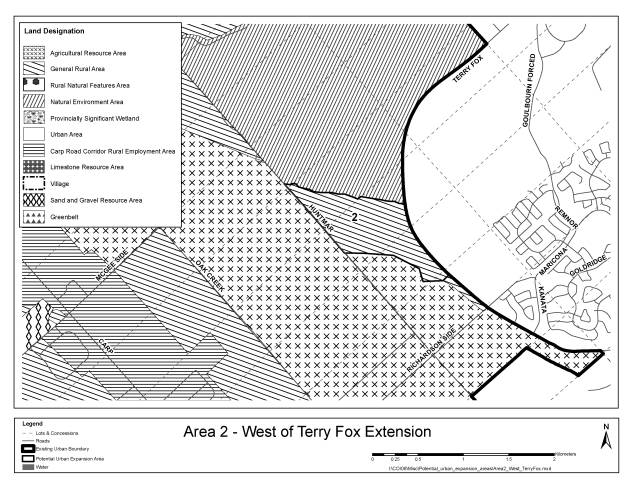
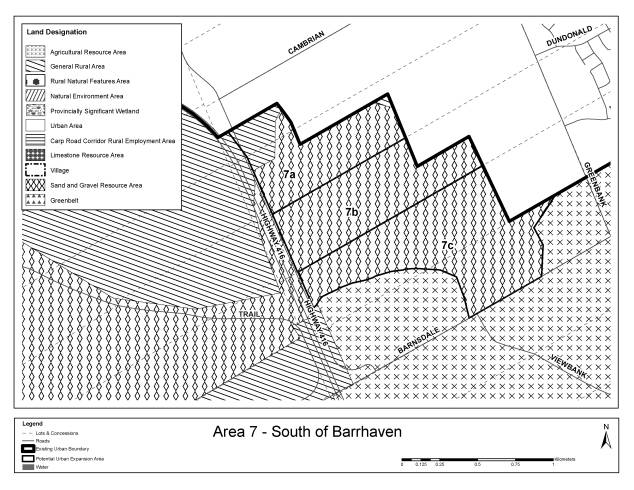
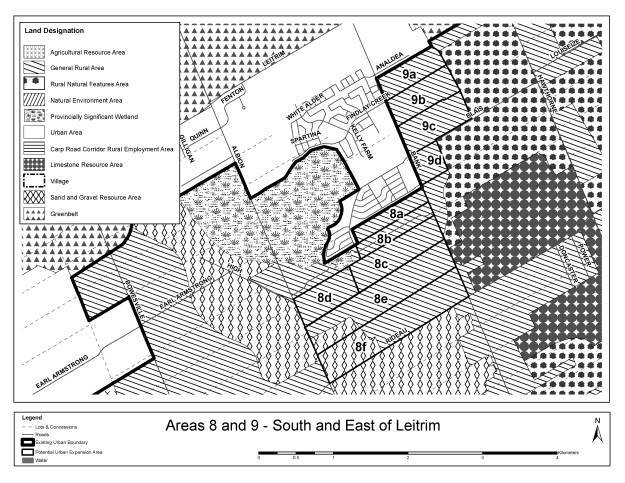
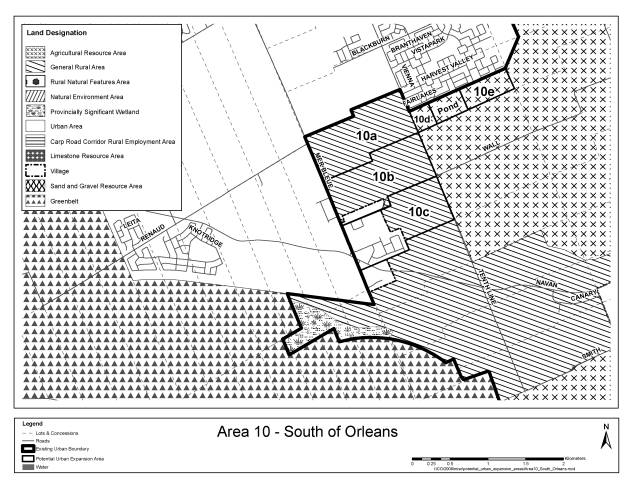
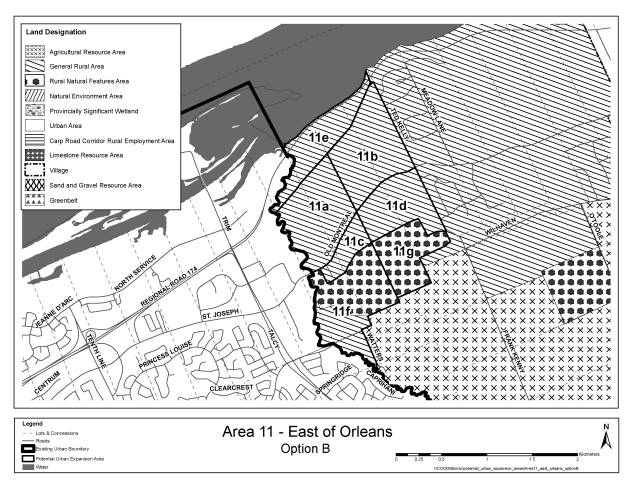
The areas that were included as candidate areas for analysis are shown on the maps in Annex 1. The tables in Annex 1 provide a basic description of each candidate area including the location, size, designation, zoning, current and adjacent land uses. Any relevant planning history is also provided.
The lands selected as candidate areas were not influenced by ownership or by the submission of planning applications. However, three landowners submitted studies to indicate that the Agricultural Resource Area designation on their land was inappropriate. Annex 2 is the staff response to these studies. Otherwise, the existing designations were taken at face value and not reviewed.
Annex 3 is a list of submissions received during the review process. While this material was scrutinized, it was not the basis for identifying candidate areas.
Definition of Gross Residential Hectares
The objective is to identify an additional 850 hectares of gross residential land. Gross residential land includes residential land, public streets and a limited range of non-residential uses typically found in a neighbourhood such as parks, schools, community centres, churches, convenience level retail and stormwater facilities. It is usually measured in dwelling units per land area. It does not usually include significant natural areas that would be ‘in addition to’ the gross residential requirements.
The candidate areas have been examined with respect to the presence of natural heritage features. The land described as natural heritage is subtracted from the parcel size and the remainder is the gross residential area of the candidate parcel.
Evaluation Criteria
As
stated earlier, the overall objective is to select areas that make the best use
of existing available infrastructure capacity and community resources. These parcels should be developable within a
reasonable period of time such as the in the next five to 10 years. The Official Plan is reviewed every five
years and the condition of City infrastructure is monitored continuously. Lands that score lower today may very well
be good candidates later.
It is very clear that each of the candidate sites could be made to work. This is very much an exercise of the relative merits of the various candidate areas.
Each candidate area has been evaluated against the criteria in Table 2. All distances are measured from the centroid of the candidate area to the facility. The possible scores are distributed as follows and then weighted:
|
Criteria |
Possible
Score |
Weight |
Total
Possible Weighted Score |
|
Servicing |
12 |
2 |
24 |
|
Transportation |
12 |
2 |
24 |
|
Community Facilities |
18 |
1 |
18 |
|
Potential Conflicts |
4 |
1 |
4 |
|
Physical Characteristics |
5 |
1 |
5 |
|
Demand for land |
4 |
2 |
8 |
|
Total |
55 |
|
83 |
Table 2 –
Evaluation Criteria and Scores
|
Criteria |
Description |
Scores |
Possible Score |
|
1.
Serviceability – Water |
Scores for each site ranged from 0 to 4 based on consideration of the factors in the next column. |
0 – major upgrade / expansion of pump station and/or distribution system required to service development area 4 – residual capacity available in pressure zone to service development area with no or minimal investment in existing distribution system |
4 |
|
2.
Serviceability – Wastewater |
Scores for each site ranged from 0 to 4 based on consideration of the factors in the next column. |
0 – no gravity outlet; may require new local pump station and forcemain due to topographic conditions; capacity upgrades required in external trunk sewers and / or pump station 4 – existing trunk sewers and / or pump stations have residual capacity to service development area with no or minimal investment |
4 |
|
3.
Serviceability – Stormwater |
Scores for each site ranged from 0 to 4 based on consideration of the factors in the next column. |
· 0 – existing servicing constraints; flood hazard constraints; no Environmental Management / Subwatershed Plan available to guide development area · 4 – Environmental Management / Subwatershed Plan available to guide development; little or no servicing / flood hazard constraints |
4 |
|
4.
Capacity - roads |
Examined the
existing/planned road infrastructure to determine if capacity can accommodate
demand |
·
0 – Major capacity problem will occur ·
1 – Moderate capacity problem ·
2 – Limited capacity problem ·
3 – No major capacity problem |
3 |
|
5.
Accessibility –Arterial Roads |
·
Direct access to an existing or planned arterial road |
·
0 – No direct access ·
1 – direct access to one collector road ·
2 – Direct access to one arterial road ·
3 – Direct access to 1 arterial and 1 or more collectors ·
4 – Direct access to two or more arterials |
4 |
|
6.
Accessibility – Transit |
·
Distance to existing or planned rapid transit network or to park and
ride. The average is 2.9 km. The points measure up to 25% more or less
and 50% more or less |
·
0 points – more than 4.4 km ·
1 points – 3.8 to 4.4 ·
2 points – 3.0 to 3.7 ·
3 points – 2.3 to 2.9 ·
4 points – 1.6 to 2.2 ·
5 points – 0 to 1.5 |
5 |
|
7.
Accessibility to existing or planned retail/commercial focus |
·
Distance to Mainstreet or Mixed Use Centre. The average is 4.6 km. |
·
0 points – more than 6.9 km ·
1 points – 5.9 to 6.9 ·
2 points – 4.7 to 5.8 ·
3 points – 3.6 to 4.6 ·
4 points – 2.4 to 3.5 ·
5 points – 0 to 2.3 |
5 |
|
8.
Ability to work in community |
·
Jobs/Housing Balance. This is
cumulative, starting at the parcel nearest to the urban boundary |
·
0 – insufficient (<1.10) ·
1 – 1.1 to 1.19 ·
2 – 1.2 to 1.24 ·
3 – 1.25 or more |
3 |
|
9.
Accessibility to community facilities |
·
Distance to Major Recreational Facility. The average distance is 3.3 km |
·
0 points – more than 4.9 km ·
1 points – 4.2 to 4.9 ·
2 points – 3.4 to 4.1 ·
3 points – 2.6 to 3.3 ·
4 points – 1.7 to 2.5 ·
5 points – 0 to 1.6 |
5 |
|
10.
Availability of existing or planned emergency services |
·
Distance to emergency fire, ambulance and police (total /2). The average distance is 5.7 km |
·
0 points – more than 8.5 km ·
1 points – 7.2 to 8.5 ·
2 points – 5.8 to 7.1 ·
3 points – 4.4 to 5.7 ·
4 points – 2.9 to 4.3 ·
5 points – 0 to 2.8 |
5 |
|
11.
Conflicting Land Uses |
·
Agricultural Resource Area within 500 metres |
·
0 – yes ·
2 – no |
2 |
|
12.
Conflicting Land Uses |
·
Adjacent rural development:
Country Lot or Village Development |
·
0 – yes ·
2 – no |
2 |
|
13.
Environment – soil constraints |
·
Presence of potential soil constraints |
·
0 – present ·
2 – absent |
2 |
|
14. Depth
to Bedrock |
|
·
0 – 0-2 metres ·
1 – 2 to 3 metres ·
2 – 5 to 10 metres ·
3 – 10 to 15 metres |
3 |
|
15.
Land Absorption |
·
Approximate years supply in 2007 |
·
0 – >21 (Riverside South) ·
1 – 20 to 21 (Leitrim) ·
2 – 18 to 19 (Kanata, Stittsville) ·
3 – 16 to 17 ·
4 – <16 (South Nepean, Orleans) |
4 |
|
Total |
|
|
55 |
Distribution of 850 hectares to Urban Centres Outside the Greenbelt
Various ways exist to distribute the 850 hectares of additional urban land. In total size it is equivalent to an area 50% larger than the designated urban area of Leitrim or to an area about half the size of the total urban area of Stittsville.
1. Council could place it all in one location to facilitate comprehensive planning of the lands. This is not recommended because such a strategy will have the greatest impact on the demand for services. It is intended that this addition be more of a rationalization of the urban boundary and not the creation of a new community. This particular work is looking for the location that makes the most efficient use of existing infrastructure and services.
2. Council could distribute it based on the existing absorption rate in each urban centre of Kanata/Stittsville, South Nepean, Riverside South, Leitrim and Orleans. This approach treats the Nepean South market as completely distinct from the Riverside South market. Table 3 summarizes the land consumption patterns over the last 10 years and the implications for land supply if the 850 hectares will contribute to providing a similar number of years supply in each area.
Table
3– Potential Distribution of 850 Ha Based on Historical Absorption Rates in
Urban Centres
|
Area |
10-year demand (average
per year) Net Hectares1 |
Total Supply of Vacant
Land (net ha 2007) |
Approximate years supply (end of 2007) |
Proposed Additional Gross
Residential Hectares |
Approximate years supply
with additions (end 2007)2 |
|
|
Kanata - Stittsville |
48.0 |
880.7 |
18.3 |
315 |
21.6 |
|
|
South
Nepean |
34.9 |
501.3 |
14.4 |
1703 |
16.8 |
|
|
Riverside
South |
9.6 |
552.7 |
57.5 |
0 |
57.5 |
|
|
Leitrim |
6.3 |
138.3 |
22.0 |
0 |
22.0 |
|
|
Orléans |
30.7 |
477.1 |
15.5 |
365 |
21.5 |
|
|
Total |
126.5 |
2,550.1 |
20.2 |
850 ha |
23.5 |
|
|
*
Notes: 1.
Total does not add because Leitrim average is based only on the 5-year period
2003-07 during which there was building activity. 2. Gross ha are converted to net
ha based on an assumption of 50%. 3. Only 170 ha have been
identified as candidate areas in South Nepean so this is the maximum total
that can be added. |
|||||
3. Council could distribute the 850 hectares based on growth patterns in three urban centres in the west, south and east. This treats the South Nepean, Leitrim, Riverside South market as a block. Over the next 20 to 25 years it is highly likely that the rate of growth in Riverside South will increase in response to the construction of rapid transit as well as the Strandherd-Armstrong Bridge. Such an approach is described in Table 4.
Table 4 – Potential Distribution of 850 Ha
based on Historical Absorption Rates in Generalized Urban Locations
|
Area |
10-year
demand (average per year) Net
Hectares |
Total
Supply of Vacant Land (net ha
2007) |
Approximate
years supply (in 2007) |
Proposed
Additional Gross Residential Hectares |
Approximate
years supply with additions (end 2007) |
|
West |
48.0 |
880.7 |
18.3 |
425 |
22.8 |
|
South |
47.7 |
1,192.3 |
25.0 |
0 |
25.0 |
|
East |
30.7 |
477.1 |
15.5 |
425 |
22.4 |
|
Total |
126.5 |
2,550.1 |
20.2 |
850 ha |
23.5 |
4. Council could distribute the 850 ha equally among the three urban areas east, west, and south. This is shown in Table 5. It does not recognize the historical trends in each area.
Table 5 – Potential Distribution of 850 Ha
based on an equal share to Generalized Urban Locations
|
Area |
10-year
demand (average per year) Net
Hectares |
Total
Supply of Vacant Land (net ha
2007) |
Approximate
years supply (in 2007) |
Proposed
Additional Gross Residential Hectares |
Approximate
years supply with additions (end 2007) |
|
West |
48.0 |
880.7 |
18.3 |
283.3 |
21.3 |
|
South |
47.7 |
1,192.3 |
25.0 |
283.3 |
28.0 |
|
East |
30.7 |
477.1 |
15.5 |
283.3 |
20.1 |
|
Total |
126.5 |
2,550.1 |
20.2 |
850 ha |
23.5 |
Comparison of Areas
Annex 1 includes a profile
of each area and summarizes each evaluation. Such an analysis results in the
following distribution of additional urban land (Table 6).
Table 6– Potential
Distribution of 850 Ha Based on Comparison of all candidate areas based on
criteria
|
Area |
10-year
demand (average per year) Net
Hectares |
Total
Supply of Vacant Land (net ha
2007) |
Approximate
years supply (in 2007) |
Proposed
Additional Gross Residential Hectares |
Approximate
years supply with additions (end 2007) |
|
West |
48.0 |
880.7 |
18.3 |
445.1 |
23.0 |
|
South |
47.7 |
1,192.3 |
25.0 |
121.4 |
26.3 |
|
East |
30.7 |
477.1 |
15.5 |
228.6 |
19.2 |
|
Total |
126.5 |
2,550.1 |
20.2 |
795.1 |
23.3 |
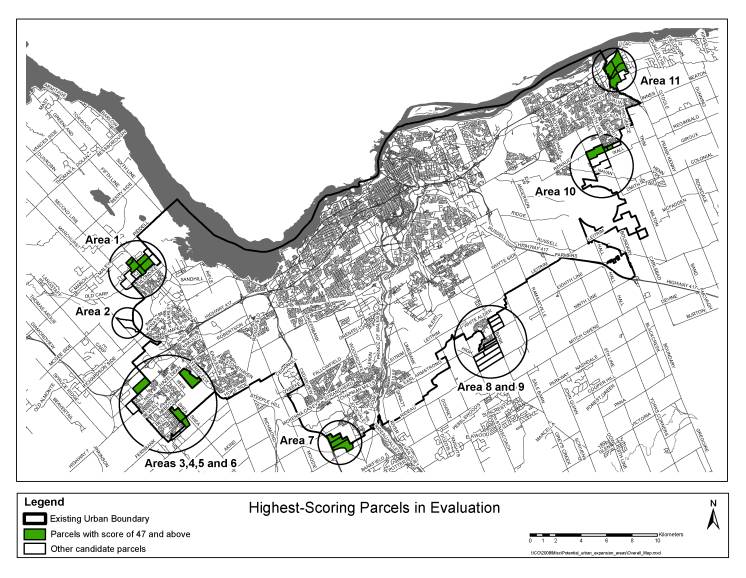
The specific scores in order from highest to lowest are shown in Table 7. It is recommended that the shaded parcels be included in the Urban Area. These are also shown on Map 1.
The objective was to
identify 850 ha of additional urban residential land. Based on the evaluation, approximately 800 hectares are clearly
identified as scoring high enough to be included. The next two parcels have the same score but together they bring
the total to approximately 900 ha. They
have therefore been excluded.